Seattle Bag Tax
and Styrofoam Ban
Local
- Northwest Economic Policy Seminar
- Seattle City Council
- Seattle News
- California
- Colorado
- Maryland
- New York
- North Carolina
- Oregon
- Texas
- Washington D.C.
- Australia
- Canada
- China
- India
- Ireland
- Scotland
- South Africa
- United Nations
- Plastic Bags
- The 3 R's
- Survey
- General References
National
International
Topics
The Plastic Bag
Life Cycle
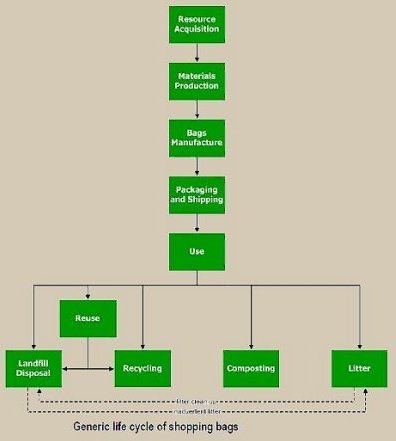
Reduce
The principle of Reduce, Reuse and Recycle -- in that order -- is an important part of the plastic bag life cycle and promotes sustainability of the environment. As mentioned in the Herrera Report, Seattle citizens have recently shown a strong interest in accelerating recycling and waste reduction technologies.
Source reduction is a form of waste prevention in which the design, manufacture, purchase and use of materials is measured in order to minimize the amount and toxicity of waste before it is ever generated. This process involves time, hard work and is often difficult to market to consumers. However, the plastics industry has made significant progress in source reduction and the standard plastic bag now requires 70% less plastic than 20 years ago. Measuring criteria such as weight, distance to transport, and renewable energy used have allowed for more lightweight bags without any loss of quality of functionality. In addition, improvements to base and handles have made most bags strong enough to hold up to 25 to 44 lbs. of goods. Continued technology improvements and proper packing techniques will help minimize negative effects of plastic carrier bags.
The paper industry has also made progress in the last decade and can use its own waste as biomass energy for production. However, paper bags remain a major source of methanol, hydrochloric acid and ammonia emissions, accounting for roughly 7.8 million pounds or 26% of toxic releases in Washington in 2004. Seattle is the only city in the world that is considering a tax on paper bags and residents have cited concerns over the state’s lumber industry, nonexistent paper bag litter, and rainy weather which causes paper bags to easily break.
Reuse
Approximately 80% of consumers nationwide reported that they save and reuse plastic bags. Plastic bags are typically reused for pet pickup, diaper disposal, wet storage, transport, donation to hospitals and nonprofits and trash bin liners. Additional uses include usage for paint preserves, kitchen cleanup, lunch bags, dust protectors and for travel items. It is the responsibility of the consumer to reuse good bags as liners instead of tossing them in the trash.
Similarly, conservation by retailers and grocers in terms of discouraging double bagging, establishing in-store recycling stations and educating employees on recycling and packing techniques will help manage plastic bag use and prevent an excessive amount of bags ending up in landfills.
Recycle
Recycling is beneficial because it reduces the strain on non-renewable energy sources and creates a way to reuse the product as a new commodity. The American Plastics Council cites that more than 1,800 American businesses handle or reclaim post-consumer plastics. Those from the municipal solid waste stream are typically collected from curbside recycling bins or drop-off sites.
Seattle Public Utilities began its curbside recycling program for paper bags in 1988 and extended it to plastic bags in 2000. The city accepts clean and dry plastic shopping bags, dry cleaning bags and newspaper bags for its curbside recycling program. However, there is currently no recycling option offered for polystyrene (Styrofoam) containers or polypropylene (A type of plastic used in producing 'reusable' bags).
The recovery of plastic recycling has been small but growing; 1.4 million tons or 3.9% of the plastics produced nationwide in 2003 were recovered. In 2005, 1.65 million tons or 5.7% of the 28.9 million tons of plastic generated were recovered. Despite the growth of plastic recycling, existing challenges include sorting costs, lacking infrastructure, technology constraints and the market which often makes it cheaper for producers to use virgin plastic over recycled plastic. However, demand for recycled plastic products is on the rise because of the many opportunities for growth in this market.
In the recycling process, bags are collected, sorted, baled and sold to Pacific Rim countries where it is manufactured into new products such as industrial trash can liners, flower pots, drain pipes and new plastic bags. Recycled bags are also used to make plastic ‘lumber’ which can be used to make decks, marinas as well as other residential and commercial properties. On the other hand, polypropylene— a type of plastic used to produce ‘reusable’ bags— do not biodegrade and is currently not accepted at King County recycling centers due to their relatively low volume.
Following the 3R’s cycle, the remaining plastic bags are sent to waste-to-energy incinerators, which harnesses energy released in combustion and converts this energy into electricity. Plastic’s petroleum composition allows it to release high energy levels of 18,500 Btu per pound when burned off as opposed to coal, which only provides 8,500-14,000 Btu per pound. In addition, polyethylene burns cleanly without fumes, mixes solid waste (to burn more efficiently) in waste-to-energy incinerators and releases only carbon dioxide and water into the atmosphere. Plastic bags are also sent to landfills where they take up one-seventh of the space of paper bags.
An emerging trend in the recycling industry is the idea of Extended Producer Responsibility (EPR). The idea is that companies that produce items such as polystyrene containers should provide a service to pick up and recycle any product it sells.
References
U.S. Environmental Protection Agency (EPA) Municipal Solid Waste (MSW)
The EPA website provides data on th national use, recycling, source reduction and production of plastic bags. The step-by-step analysis on how plastics are made and recycled were used to construct a life cycle analysis for a general shopping bag. The resin codes and chart describing types of plastics provided information on the varities of plastic bags that are used in the U.S.
National Litter Pollution Monitoring Systems, May 2003
The National Litter Pollution Monitoring System addresses the problem of the quantity, composition and causes of litter in Europe. The data produced in the report allows authorities to change the level of litter from different locations over time, analyze the impact of new legislation and target the source and causes of litter.
Comparison of existing life cycle analysis of shopping bag alternatives
Hyder Consulting produced a report for Sustainability Victoria, which compiles existing life cycle assesment (LCA) data to compare the varying environmental impacts of shopping bag alternatives in Australia. The study reflects on the postive and negative social, environmental and scientific aspects of reusable, biodegradable, HDPE and paper bags by analyzing the amount of material, energy, litter, water and contribution to global warming that goes into producing each type of bag.
SPI - The Plastics Industry Trade Association
SPI is a plastics industry trade association founded in 1937. The group provides information on sustainability by promoting conservation, reuse and recycling programs. The website also addresses the beneficial role that plastics play in solid waste incineration and landfills compared to alternatives.
Plastic Bag Externaities and Policy in Rhode Island
This report written for environmental law and policy examines externalities associates with the production and disposal of plastic bags in terms of CO2 emissions, water pollution and solid waste. This study aimed to reduce the amount of solid waste in Rhode Island's Central Landfill by examining the effects that paper and plastic bags have on landfill space.
Report of Washington State’s Recycling Industry (2002)
This study was commissioned by King County and provides quantitative summaries of recycled and remanufactured materials processed in Washington State in 2001. The aim of the report is to measure and document the private recycling industry by focusing on employment, capital investment and material handling to assess trends, emerging markets and opportunities in the industry.
Seattle Public Utilities Litter Composition Study (2001)
The Cascadia Consulting Group and Seattle Public Utilities developed this "litter" analysis on waste found in public trash cans throughout the city of Seattle. Take note that the report does not take actual street litter into account-- all figures on Seattle's litter composition are a result of individuals rummaging through public trash bins and recording the types of garbage people throw away.
Seattle Public Utilities Residential Waste Stream Composition Study (2006)
Another report by the Cascadia Consulting Group that provides data on levels of paper, plastic, glass, metal and organic waste generated by residences in King County. The study breaks down litter composition by household income and size and measures annual percentage changes in various waste categories. Results show that plastic film components comprise a very small percentage of residential litter as food, animal by-products, mixed low grade and compostable paper are disposed in far greater weights than plastic film.
Seattle residential recycling composition study (2005)
The Residential Waste Stream Composition Study conducted by Seattle Public Utilities has been ongoing since 1988 and aims to analyze the composition of waste from residential recycling pickups. The study concluded that 'plastic bags and packaging' account for a mere 0.3%-0.5% (or 127 tons/yr) of residential waste. In contrast, paper was found to account for 75.3% (or 23,793 tons/yr) of residential waste with non-recylable glass following at 17% (5,385 tons/yr).
Seattle Public Utilities Survey Results (2007)
This survey was conducted by Elway Research, Inc. for Seattle Public Utilities in December 2007. The results clearly indicate that voluntary reductions of plastic bag usage are favored over fees and bans. The survey also showed strong support for stores to voluntarily reduce plastic bag usage by providing in-store recycling bins for shoppers among other measures.
Alternatives to Disposable Shopping Bags and Food Service Items (2008)
Volume I
Volume II
The “The Herrera Report” is the study, commissioned by the city, to look at the plastax and polystyrene ban issues. Herrera is a very reputable local engineering firm. The study however, appears to have been grossly under-funded at $50,000. A robust study like this could cost as much as $300,000 to do carefully. While it is doubtful that the numbers are very accurate, it is the only attempt at cost benefit analysis for the Seattle proposal. Pay especially close attention to the tables, as they contain the crux of the analysis including costs and environmental impacts.